Case study · Indosat & Telkomsel distribution · 2024–26
Dashboards that outgrew Power BI.
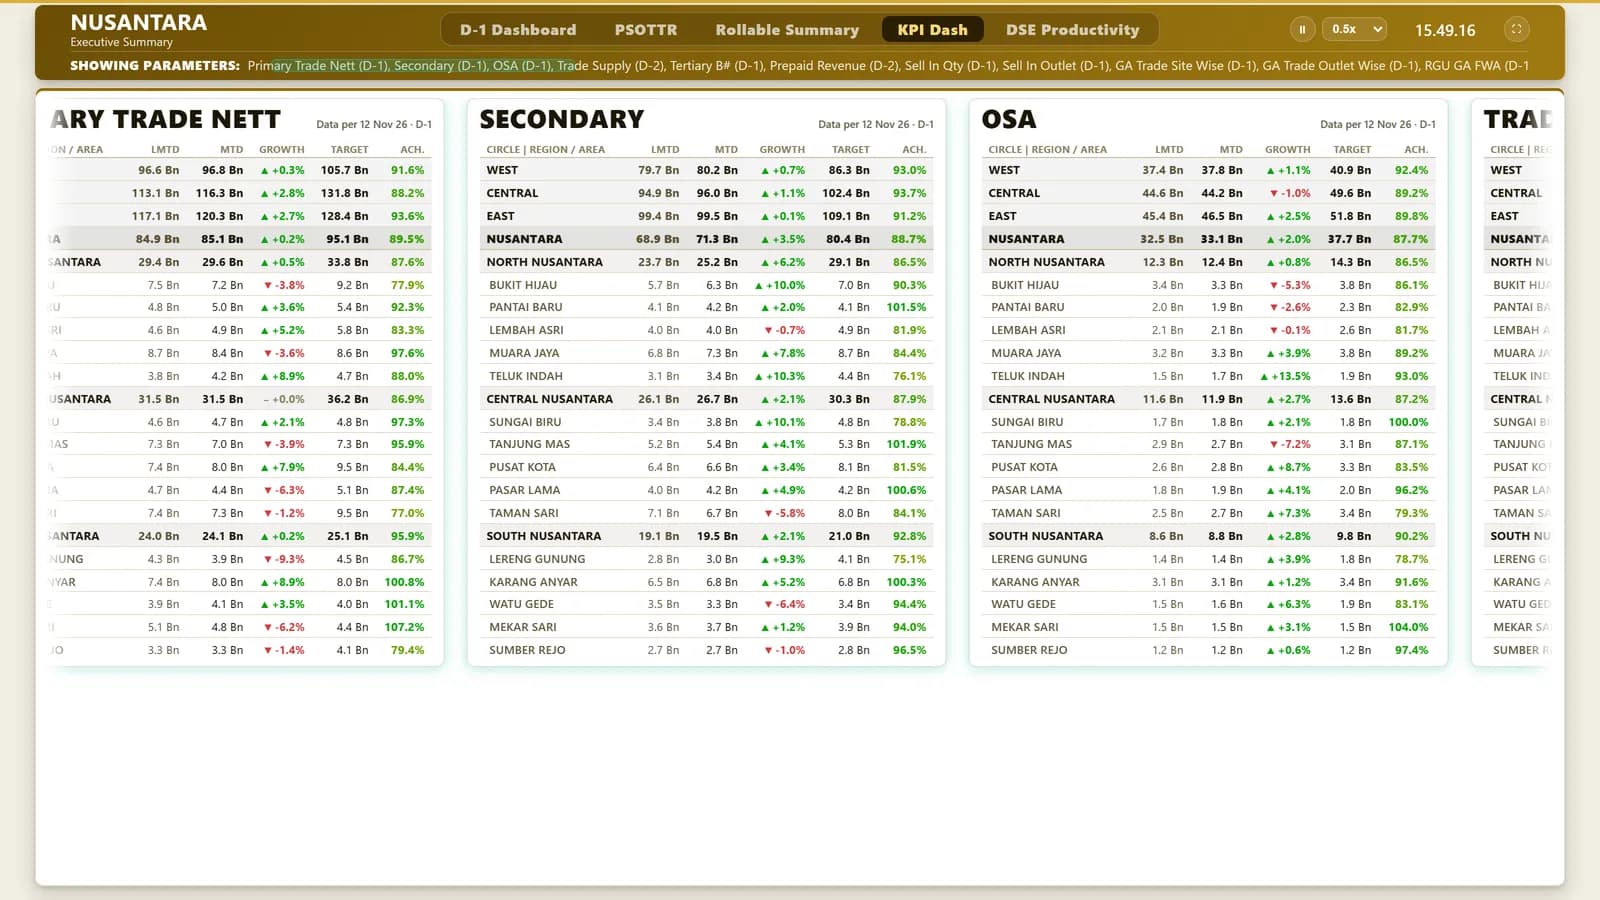
The main one runs on the office TV: yesterday's sales KPIs for every region and branch, worst performers first, rebuilt by itself whenever a fresh export lands in its folder. Next to it, a self-serve GA dashboard and a partner quadrant replace hand-built pivots and a long Excel formula.
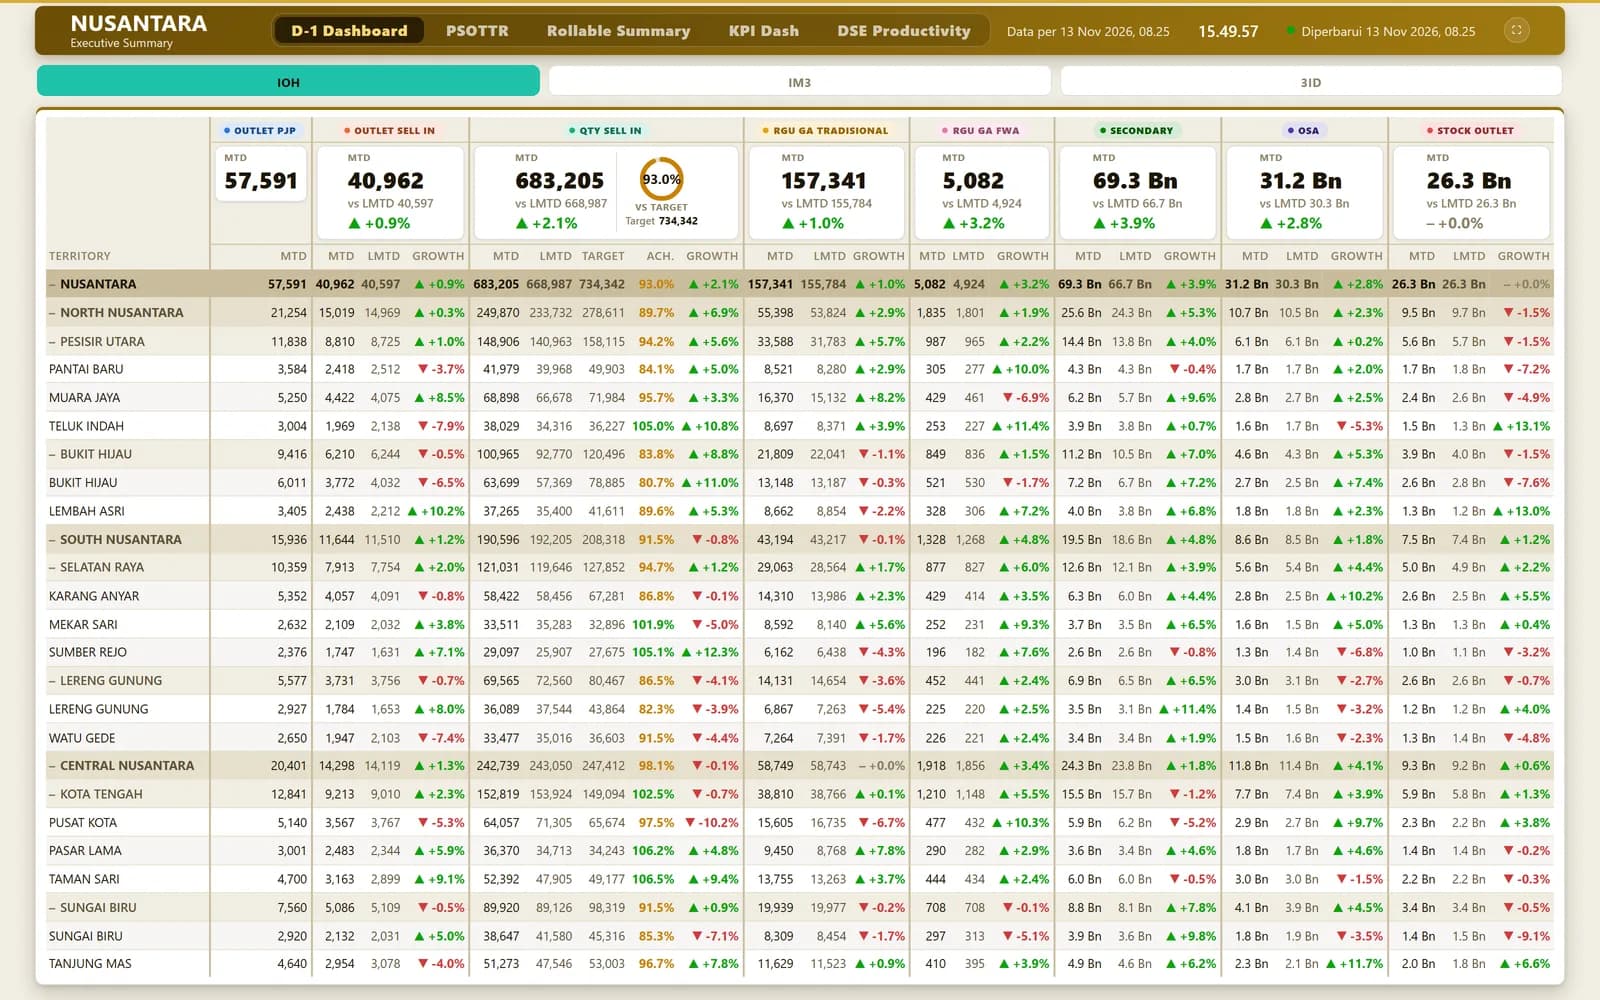
Screens: the real app running on made-up demo data. No real people, outlets or figures.
01 · The TV, every morning
Drop the file, the TV catches up.
- 1
Drop or upload exports
Through a login-gated admin page, each file goes to its category folder: sell-in, brand KPIs, PSOTTR, targets, DSE.
- 2
Newest file wins
In each folder the most recently modified file is read, whatever its name.
- 3
Compute
pandas rolls everything up to circle, region and branch; IOH is IM3 plus 3ID.
- 4
Serve
The TV asks for fresh numbers every five minutes and for display settings every 20 seconds.
- 5
Cycle
Five pages (D-1, PSOTTR, Rollable Summary, KPI Dash, DSE Productivity) rotate through the brands on their own.
02 · Try the colours
When does a branch turn red?
Move one branch's numbers. Achievement, growth and the worst-first order follow the TV's own rules. Below it, score a distributor on the partner quadrant.
Move the numbers for one branch's Secondary sales:
Ach.
90.2%
80–99.9%
Growth
▲ +4.5%
vs LMTD
Rounded to one decimal before colouring, so 99.96% shows as 100.0% and is green, never a red “100.0%”.
Partner Quadrant: score one distributor.
Willingness
Capability
It replaces one long Excel IF formula with a chart a manager can read at a glance.
03 · Under the hood
Built to run unattended.
Re-read only when files change
A signature of each newest file's path, modified time and size; the heavy parse runs again only when it changes.
Worst first
Regions and branches are sorted by achievement, lowest first, missing values last; sister regions stay side by side.
Colours that agree with the text
Achievement is rounded to one decimal before colouring: 100% and up green, 80% and up amber, below red. Growth gets an arrow only beyond ±0.05%.
Numbers a TV can show
Scaled to K, M, Bn and Tn with one decimal; English units, because the Indonesian “M” means billions.
GA Sankey
Two to four stages (for example channel → outlet category → region); each keeps its top nodes and the rest become “Lainnya”; drawn as hand-written SVG curves.
Partner quadrant
Willingness and capability are weighted averages; 80 and up on both is Strategic, then Performance, Growth and At Risk.
04 · Who sees what
Open on the TV, locked behind it.
The TV
The display and its data are public on purpose, so it keeps showing numbers unattended.
TV admin
Uploads and settings need a login: PBKDF2 with 200,000 iterations, no default password, 12-hour sessions.
GA dashboard
Everyone signs in; admins import data and edit layouts, viewers explore.
05 · The small stuff
Small things a wall screen needs.
Never stale code
Every response says no-store, so the kiosk browser never keeps an old version.
Last good data stays
If a refresh fails, the last numbers stay up under a banner.
Clear upload errors
Each category accepts only its file types up to 30 MB, and the browser gets the real error message.
Lower is better, sometimes
For travel time an up arrow is coloured as bad.
Data as of
Each page shows its own data date, set by the admin or taken from its files.
Shared layouts
The GA dashboard's widgets are dragged into place; other people's edits arrive every few seconds, with the last 300 versions kept.
Tidy imports
Marketing names are trimmed and the most common spelling wins among case variants.
Pivot engine
Subtotals per level, empty values labelled, and capped at 5,000 rows and 40 columns.
06 · How it fits together
Three tools, one idea: no manual pivots.
Office TV
D-1 KPI dashboard
Excel folders → a Python pipeline (pandas, openpyxl, pyxlsb) with a signature cache → a standard-library server → the TV page.
Web
GA dashboard
CSV and Excel imports → SQLite through Prisma → pivots, charts and Sankey widgets in Next.js.
Web
Partner quadrant
A static site: scores in the browser, a Chart.js bubble chart, config as JSON.
07 · Tech stack
What each piece does.
Python http.server
The TV's server, no framework.
pandas, openpyxl, pyxlsb
Reading the Excel exports.
Vanilla JS + CSS
The TV page, its cycling and marquees.
Next.js + Prisma + SQLite
The GA dashboard.
Hand-written SVG
The Sankey flows.
Express + Chart.js
The partner quadrant.