Case study · Indosat · Marketing division · 2026
Budget Tower: a division's budget, from plan to paid.
Marketing tracked its spending in one big workbook: proposals on one sheet, payment requests, POs and receipts on another, and pivots on top. Budget Tower reads that workbook and shows what's approved, committed, paid and left, quarter by quarter.
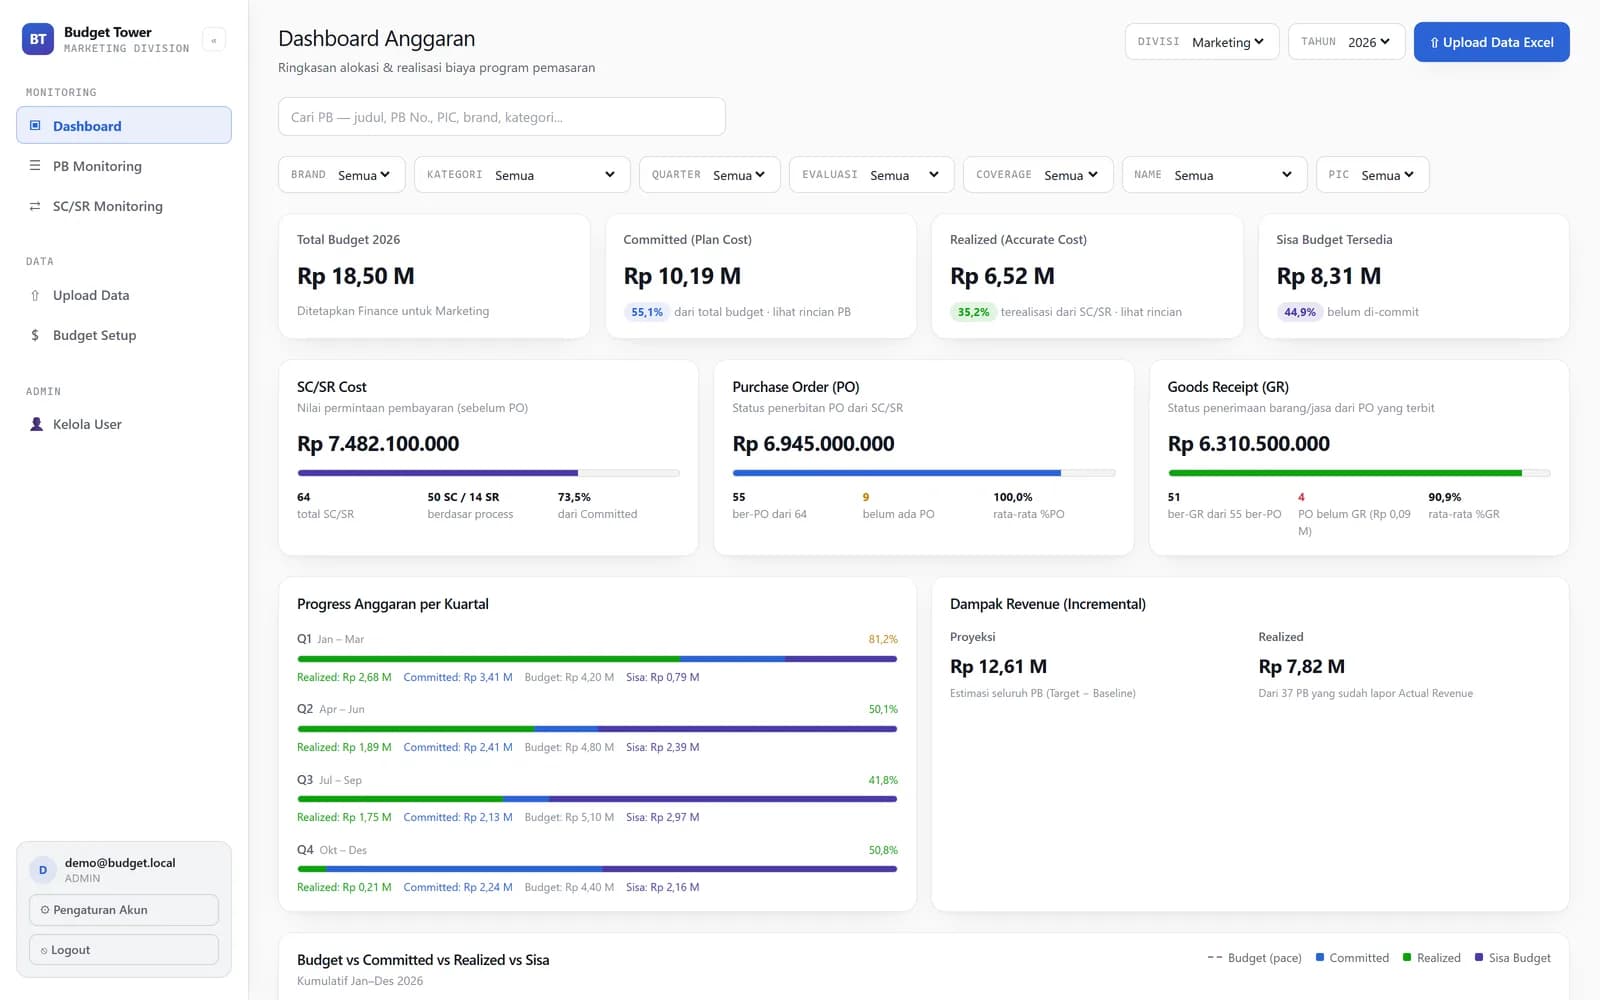
Screens: the real app running on made-up demo data. No real people, outlets or figures.
01 · How it's used
Set the budget, upload, read.
- 1
Set the budget
Q1–Q4 per division and year; the yearly total is their sum.
- 2
Upload the workbook
The proposals sheet and the payments sheet, read by column position from row 12; the upload replaces that division and year.
- 3
Read the dashboard
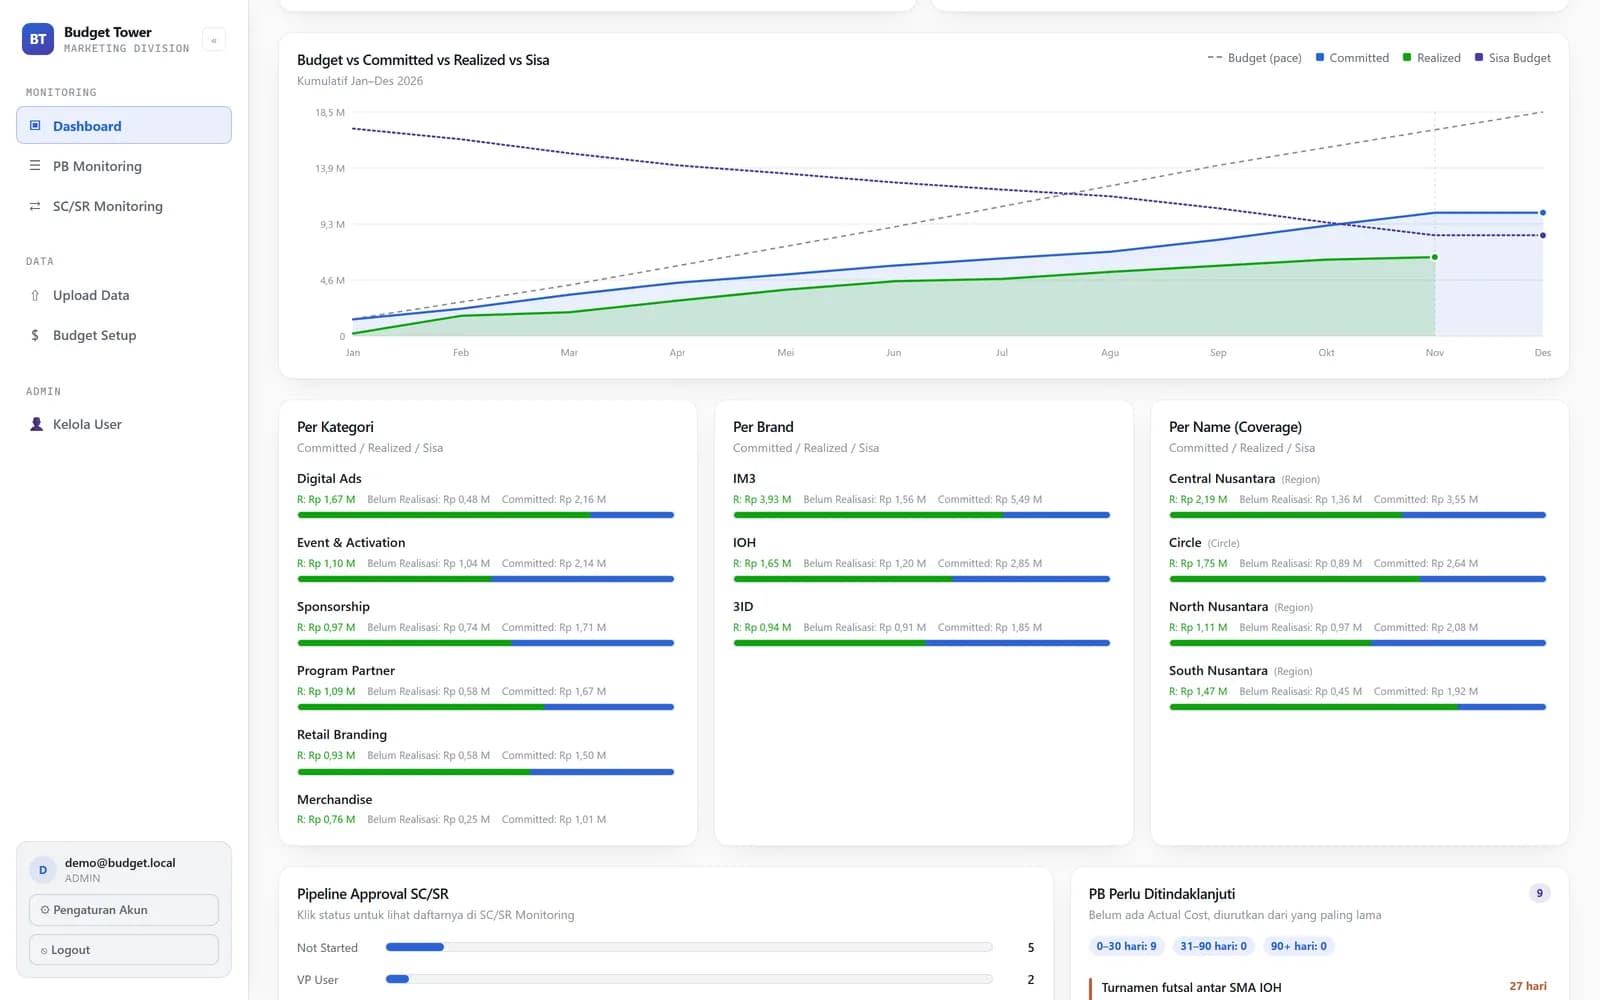
Budget, committed, realized and remaining; PO and goods-receipt progress; quarters; the burn chart; breakdowns; the approval pipeline.
- 4
Drill down or export
Every number opens the matching rows, already filtered; export rebuilds the workbook.
02 · Try a quarter
Watch a quarter fill up.
Move the budget, what's committed and what's been paid. The bar and the colour follow Budget Tower's own rules.
Q1 Jan – Mar
81,2%
Under 80%room to spend
80 – 99.9%close to the ceiling
100% +over budget
Remaining is counted against what's committed, not what's paid: once a proposal is approved, that money is spoken for.
03 · Under the hood
Three numbers, computed the same way everywhere.
Committed, realized, remaining
Committed = the proposals' Plan Cost; realized = the payments' Accurate Cost; remaining = budget − committed. Per category, brand and name it also shows what's committed but not yet paid.
Quarter meter
Committed ÷ budget, red from 100% and amber from 80%, because here high is bad. The bar shows paid, committed-but-unpaid and what's left.
Burn chart
Twelve cumulative months against a pace line that grows through each quarter's budget; the realized line stops at the last month with data. Drawn by hand in SVG.
Payment pipeline
Requests with a PO, POs with a goods receipt (counted by amount, since dates are often missing), and the average %PO and %GR.
Outstanding proposals
Grouped by how long they've waited: 0–30, 31–90 and 90+ days, the oldest first.
04 · Who sees what
Admins and members.
Admin
Budgets, uploads, users and divisions. The last admin can't be removed.
Member
Reads the dashboards; can be limited to certain divisions.
05 · The small stuff
The parts that make a messy workbook readable.
Ghost rows ignored
The template numbers hundreds of empty rows; a row only counts if its real fields are filled.
No 1899 dates
A stray date in a text column is treated as blank, and Excel serial dates are converted properly.
Honest revenue
Actual revenue is added only for proposals that reported it, since a blank cell turns into a huge negative in the sheet.
Filters that cascade
Each dropdown offers only the values left after every other filter.
A moving GR column
If the GR date column is missing, everything after it shifts and is read one column earlier.
Strong passwords
12+ characters with mixed case, a digit and a symbol, hashed with bcrypt.
Brute force capped
Login attempts are capped per address and per email, uploads per address.
Security headers
Content policy, HSTS and no framing.
06 · How it fits together
A workbook in, a dashboard out.
Browser
Dashboards and tables
KPI cards, quarter meters, the SVG burn chart, filtered tables, export.
Cloud Run
Next.js server
Upload API parses the workbook; the dashboard is computed on the server from the stored rows.
Cloud Storage
budgets, uploads, users as JSON
next-auth
credentials, 8-hour sessions
Excel
Monitoring workbook
The same file the team already keeps, uploaded as is.
07 · Tech stack
What each piece does.
Next.js 14 + React 18
Pages, server actions and API routes.
SheetJS
Reading the workbook and writing the export.
Cloud Storage
Everything stored as JSON files; no database to run.
next-auth
Email and password login with JWT sessions.
bcryptjs
Password hashes.
Hand-written SVG
The burn chart, no chart library.
Docker on Cloud Run
Hosting, with the secret in Secret Manager.